
Resources
Core Web Vitals: A Practical Guide to a Faster, Higher Ranking Site
What LCP, INP, and CLS actually measure, the fixes that move each metric, how to measure them correctly, and the real business impact of getting them right.

Ahmad Saeed
Full-Stack Engineer, Devity Technologies
A well-designed page that loads in what feels like a reasonable amount of time can still be failing Core Web Vitals, and a business can go a long time not knowing why traffic or conversions are quietly underperforming. This guide covers what LCP, INP, and CLS actually measure, the fixes that genuinely move each one, how to measure them correctly rather than trusting a misleading lab score, and the real business impact behind what can otherwise feel like an abstract technical checklist.
LCP, INP, and CLS, Explained Properly
Core Web Vitals are three metrics Google uses to measure real-world page experience, and understanding what each one actually represents matters more than memorising a threshold number.
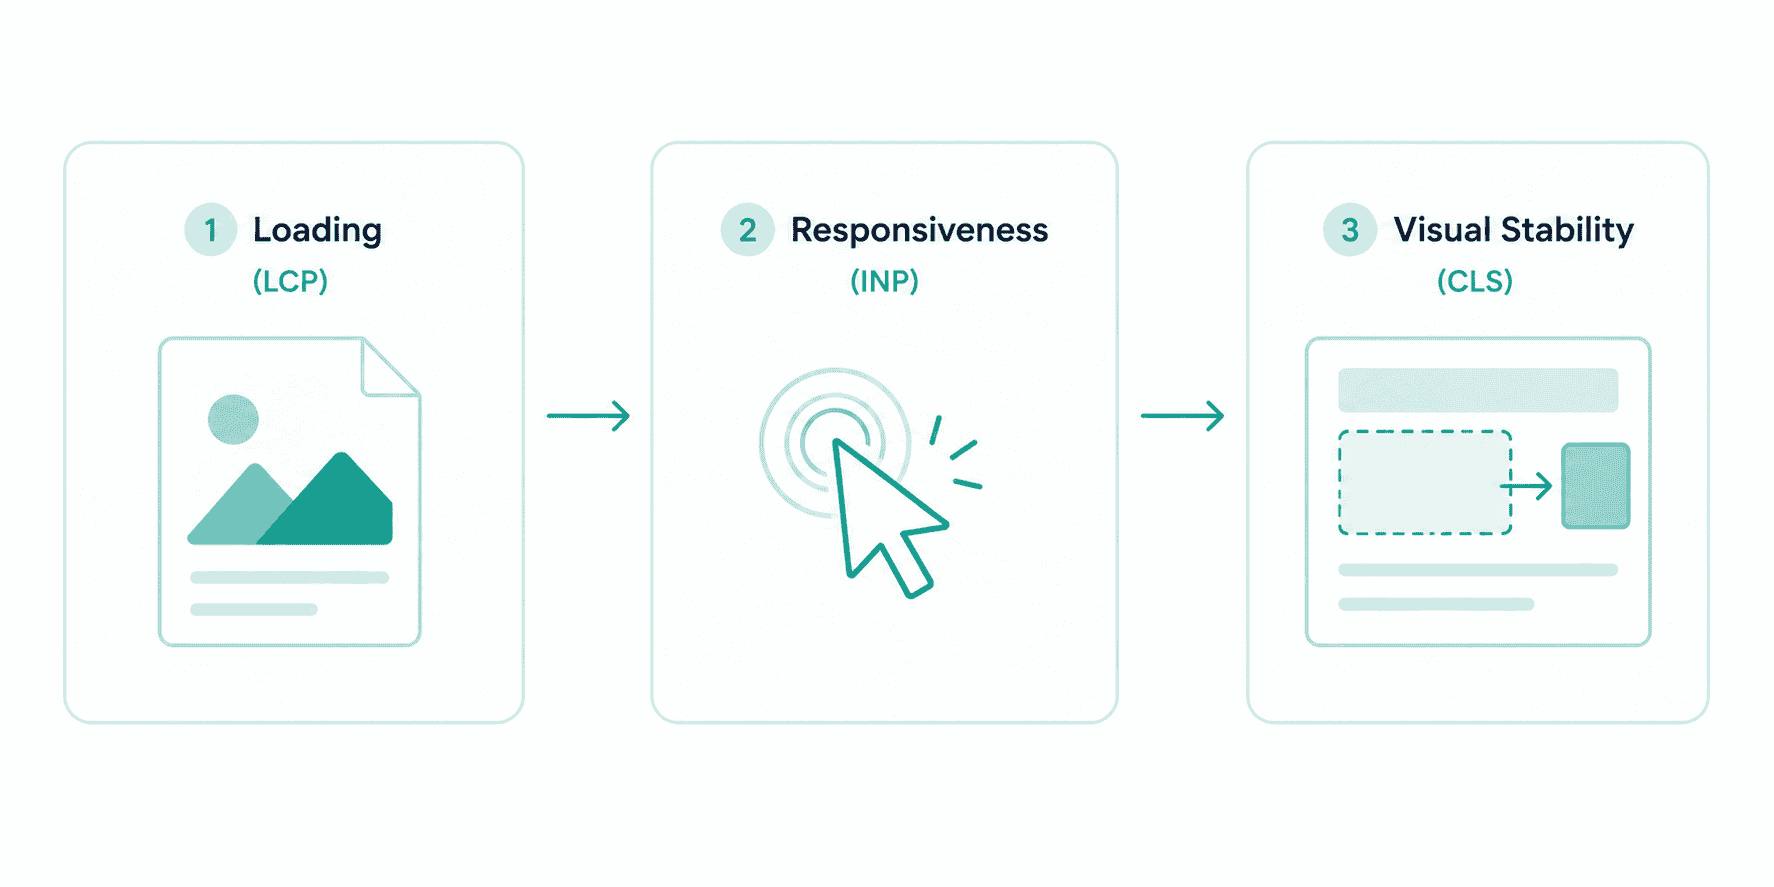
Largest Contentful Paint (LCP) measures how long it takes for the largest visible piece of content, usually a hero image or a headline block, to fully render on screen. It is a loading metric, and it is the one most directly tied to a visitor's first impression of whether your site feels fast.
Interaction to Next Paint (INP) measures how responsive your page is across every interaction throughout its lifecycle, not just the first click or tap. This metric replaced the older First Input Delay (FID) metric in March 2024, and the change matters, FID only measured the delay before a browser began processing someone's very first interaction, while INP tracks every interaction a visitor makes, making it a far more representative and considerably stricter measure of real responsiveness.
Cumulative Layout Shift (CLS) measures visual stability, specifically how much visible content unexpectedly shifts position as a page loads. This is the metric behind the frustrating experience of trying to tap a button just as an ad or image loads above it and shifts everything downward.
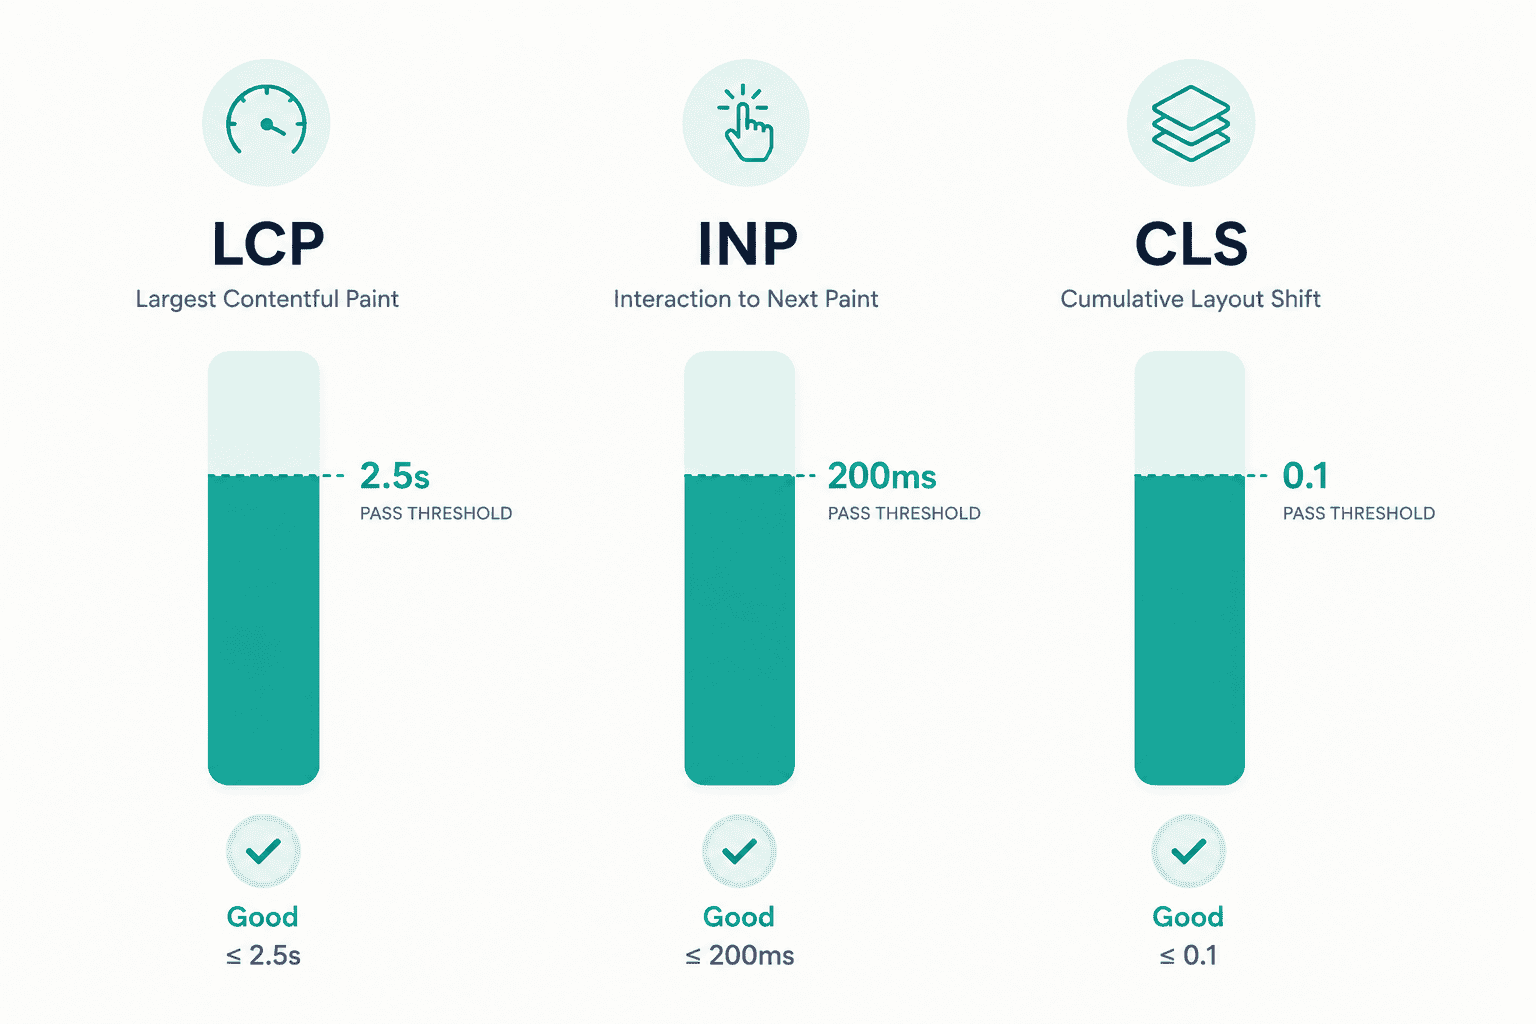
A page passes Core Web Vitals when, at the 75th percentile of real visits, LCP is under 2.5 seconds, INP is under 200 milliseconds, and CLS is under 0.1. That 75th percentile detail is important and frequently misunderstood, it means your page needs to perform well not just for your fastest, best-connected visitors, but for the large majority of real people hitting it, including those on older devices or slower connections.
How to Measure Correctly, Not Just Quickly
This is the step most guides rush past, and it is where a lot of confusion comes from.
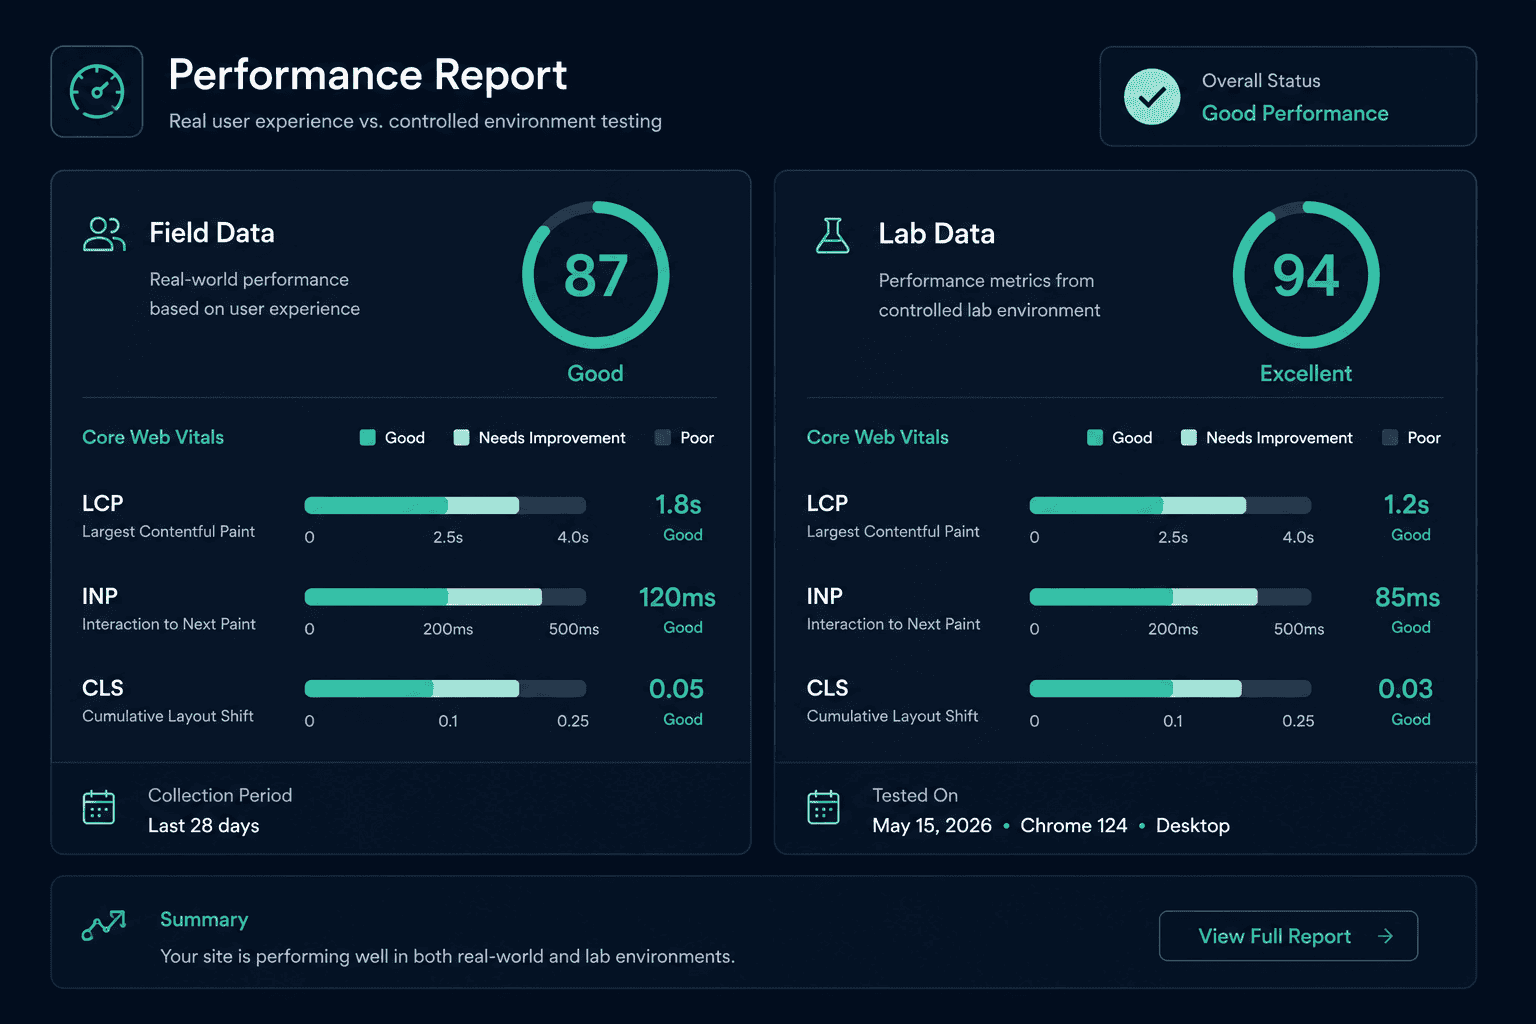
Lab data versus field data. Tools like Lighthouse produce lab data, a single, simulated test run under controlled conditions. This is useful for diagnosing specific issues, but it is not what Google actually uses to evaluate your rankings. Google's real assessment comes from field data, gathered through the Chrome User Experience Report (CrUX), reflecting real visitors' real devices and real network conditions over a rolling 28-day window.
Where to find your real numbers. Google Search Console's Core Web Vitals report shows your actual field data, broken down by URL, and is the most direct source of truth for how Google currently sees your site. PageSpeed Insights shows both field data, when enough real traffic exists to populate it, and lab data side by side, which is useful for understanding the gap between the two.
Diagnosing the specific bottleneck. Once you know which metric is failing, Chrome DevTools' Performance panel lets you dig into the actual cause, the network waterfall for LCP delays, long-task tracking for INP bottlenecks, and a layout shift overlay that visually highlights exactly which elements are moving and when for CLS issues.
Patience matters. Because CrUX data reflects a rolling 28-day window, a fix deployed today will not show its full effect in Search Console for several weeks. Judging a fix's success too early, before the CrUX window has caught up, is a common source of false conclusions about what actually worked.
Set alerts before you have a problem, not after. A reasonable practice is monitoring at roughly 80% of Google's actual thresholds, treating an INP above 160 milliseconds, an LCP above 2.0 seconds, or a CLS above 0.08 as an early warning rather than waiting until a metric has already crossed into the poor band. A sudden regression after a deployment, a new ad script, or a growing image file size is far cheaper to catch and fix immediately than to discover weeks later once it has already affected a full CrUX reporting window.
The Fixes That Actually Move Each Metric
For LCP: image preloading for your largest above-the-fold asset, inlining critical CSS so the browser does not wait on an external stylesheet before rendering key content, preloading web fonts with a font-display swap strategy to avoid render-blocking text, and server-side rendering so the browser receives meaningful content immediately rather than waiting for client-side JavaScript to build the page.
For INP: breaking up long JavaScript tasks so the browser's main thread is not blocked for extended periods, deferring non-critical scripts until after the page is interactive, and yielding control back to the browser between chunks of work rather than running one long uninterrupted task. This is generally the hardest metric to fix well, since it often requires genuine changes to how a site's JavaScript is architected, not just a configuration tweak.
For CLS: explicit width and height attributes on every image, video, iframe, and ad slot, so the browser reserves the correct space before content finishes loading, combined with font-display strategies and reserved space for any dynamically inserted content, like a cookie banner or a late-loading ad.
Which Metric to Fix First
With three metrics and limited engineering time, prioritisation matters more than most guides acknowledge. The right order is not based on which fix is easiest, it is based on which metric is furthest from passing. A metric already comfortably in the good band does not need further attention, effort spent polishing an already-passing LCP score while INP sits in the poor band is effort misallocated.
Among the three, INP is consistently the hardest to fix well, since it usually demands real changes to JavaScript architecture rather than a configuration adjustment, which is also why it remains the metric most sites currently fail. LCP tends to carry the most direct commercial impact, since it governs the first visible impression of speed a visitor forms. CLS is generally the fastest metric to fix outright, since explicit dimensions and reserved space are usually mechanical changes rather than architectural ones. A sensible approach fixes whatever is currently poor first, regardless of which metric that happens to be, then works through INP, then LCP, then CLS, rather than defaulting to the easiest wins first and leaving the hardest, most impactful problem for last.
The Business Impact, With Real Numbers
Core Web Vitals are not purely a Google ranking exercise, and the documented business impact behind them is worth taking seriously on its own terms, independent of SEO. Google's own published case studies include a Vodafone Italy A/B test where an LCP improvement alone drove a measurable increase in sales on otherwise identical pages, a session-duration increase for Tokopedia after a significant LCP reduction, and an organic traffic increase for Nykaa following LCP improvements. These are not agency estimates, they are outcomes Google itself has documented from real production sites.
The pattern behind these numbers is consistent: a slow-loading hero image, a layout that shifts as a visitor tries to interact with it, or a page that feels sluggish when tapped are not abstract technical shortcomings, they are silent conversion leaks. A contact form that lags on submission or a call-to-action button that jumps as an image loads above it costs real revenue whether or not anyone on the team ever looks at a Core Web Vitals report.
Worth knowing for context: recent Web Almanac data suggests fewer than half of mobile websites currently pass all three Core Web Vitals thresholds. That is not a reason for complacency, it is the opposite, it means a genuinely well-optimised site has a real, measurable advantage over a meaningful portion of its competition simply by passing where others do not. For a business competing in a crowded search results page against similarly relevant content, a clear, documented performance edge is one of the few remaining levers that is entirely within engineering's control to fix, rather than dependent on content strategy or backlink acquisition over time.
In Practice
Server-side rendering, one of the highest-impact fixes for LCP specifically, is a core reason we cover Next.js in depth in our guide to why it wins for business websites and apps, since a properly server-rendered page starts with a meaningful head start on this exact metric before any further optimisation work begins. If you want an honest read on where your own site's Core Web Vitals actually stand, and what is realistically fixable versus what would need a deeper architectural change, our web platform development service is a good place to start that conversation.
Passing Core Web Vitals is less about chasing a single number on a report and more about disciplined engineering, shipping less unnecessary JavaScript, reserving layout space deliberately, and prioritising what a real visitor sees and touches first. Get that discipline right, and the ranking benefit and the revenue benefit tend to arrive together, not as two separate projects.
FAQ
Questions, Answered.
Read next
More on Web Platforms
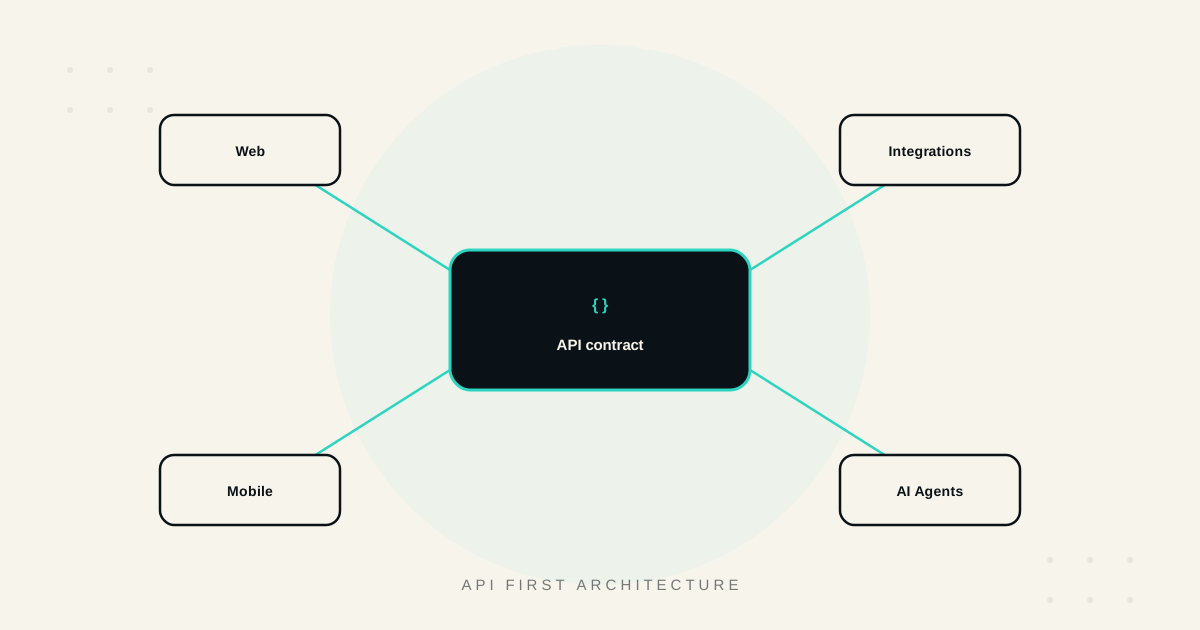
API First Architecture: Building Software That Scales and Integrates
What API-first architecture actually means, the real benefits, how it enables genuine integration and reuse, and when it matters versus when it's unnecessary overhead.
Build vs No Code for Web Apps: Where the Line Really Is
Where no-code web app builders genuinely excel, where they break down, and how to think about performance, ownership, and the migration path before you commit.

Designing for Conversion: What High Performing B2B Sites Get Right
What separates high-converting B2B websites from the rest, clarity, proof, speed, CTA design, trust, and how to actually measure whether design changes are working.